Q2 Bank Loan Trends - Community & Regional Bank Growth Continues

As we move through Q2 2018, the divergent trend between the loan growth of the largest 25 banks and that of community & regional banks continues. Data is from the Federal Reserve Bank's weekly H.8 report - Assets and Liabilities of Commercial Banks.

Community & Regional banks continue to show strong loan growth, while the larger banks have slowed. Even eliminating the impact of Wells Fargo with their regulatory-mandated balance sheet constraints, the growth rate for the other large banks remains less than one-half that of Community & Regional banks.

The variation suggests reasonably strong economies continue at the local and regional levels.

This chart below shows the diverging trends in year-over-year loan growth rates for the largest 25 banks and for Community & Regional banks. While the trends paralleled each other through summer of 2016, the growth for Community & Regional banks continued much stronger since.

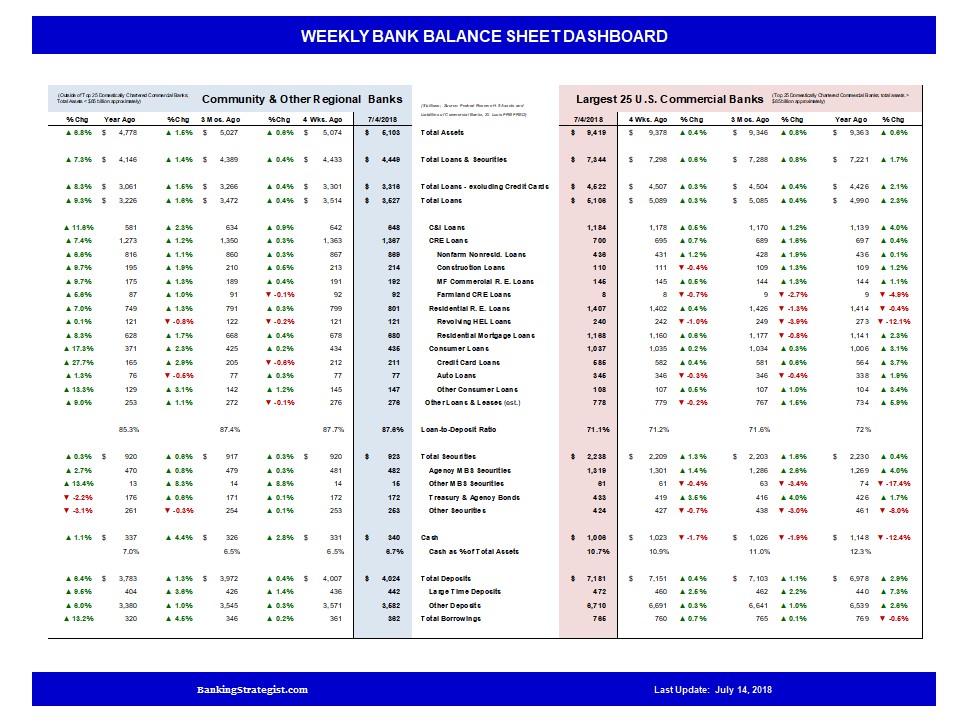
From an overall balance sheet management perspective, the strong loan growth for Community & Regional banks has resulted in some balance sheet expansion. Total assets have risen at a slightly slower pace (6.8% YoY) with loan growth funded by both solid growth in deposits (+6.4% YoY), increased FHLBank and other borrowings (+13.2% YoY) and constraint on investment securities portfolio expansion (+0.3% YoY). For Large Banks, the balance sheet has been managed resulting in negligible growth (+0.8% YoY). The modest loan growth (+2.3% YoY) was supported by modest deposit growth (+2.8% YoY) and nearly flat investment securities portfolio (+0.4% YoY).

For more trends and other information on Community Banks and the banking industry, go to Banking Strategist.

Loan Growth Divergence Continues Largest Banks Compared to Community Banks?

While loan growth continues to slow overall, the difference between the largest 25 banks as estimated and reported by the Federal Reserve (H.8 report) and community and all other commercial banks is noteworthy.

The largest 25 commercial banks are up 2.3 percent over the past year, while community and all other small commercial banks are up 7.6 percent.

There are a variety of possible explanations - and probably a combination of all:

  1. Slowing economy - at end of May, this will be the second longest economic expansion in recent history; most economists show continued slowdown after 2018.
  2. Tax cuts - the results of the tax cuts have been beneficial to corporations and have made many flush with cash; some of the cash have been used for stock buybacks and dividends, some for worker bonuses and much remains on balance sheet for future investment; if a slowing economy is forecast, will this long term investment be held back for a while?
  3. Community bank customers and communities continue to have higher borrowing needs - some good (stronger local economies) and some less good (weaker sectors such as agriculture).

Below is our weekly dashboard with the details:

Bank Balance Sheet Management as Interest Rates Rise

With Fed expected to boost interest rates another 25 bps this week, what has been happening to bank loan, deposit and balance sheet activity recently.

Loan growth has shown moderate activity in recent weeks, but remains generally flat over the past year. Smaller community banks were showing slightly better loan growth, but remains sluggish.

Interest rates continue the steady, but disciplined increases that the Fed has promised. There has also been a steady flattening of the yield curve, which may be cause for reductions in investment securities holdings by banks of all sizes.

With the latest weekly release of bank balance sheet estimates by the Federal Reserve (H.8 Assets and Liabilities of Commercial Banks in the United States), we continue to see general softening in loan growth, reduction in holdings of investment securities (yield curve slope driven?) and deposit balances flat to down. Is this bank activity reflected of the modestly growing economy? FRB Atlanta's GDPNow is reflecting lower growth expectations for Q1 2018 than recently thought - 1.8% compared to concensus forecast of 2.5%.

Banks Containing Balance Sheet Size with Lending and Deposit Activity Slowing.

Bank loan portfolio growth continues to show weakness with the largest banks up only 1.7% from year ago and weaker in recent weeks. Community banks and all other banks not in the top 25 show 6.5% year over year growth but growth is also moderating recently. Data is from the Federal Reserve's H.8 Assets and Liabilities of Commercial Banks and sourced via the FRB St. Louis' FRED economic database.

Deposit growth has also stalled across banks of all sizes. Overall balance sheets (total assets) are leveling off with investment securities portfolios showing reductions. Has the rise in interest rates and flattening of yield curve lessened profitability of these investment securities? How will the expected 3 Fed hikes throughout 2018 impact overall balance sheet size and management?

For other information and analysis, go to Banking Strategist.

Update on Fannie & Freddie 2017 Performance

Both Fannie and Freddie have reported financial results for full year 2017. Below are some topics of interest:

U.S. Treasury Net Receipts and Return on Investment: With the revaluation of deferred taxes due to the recent lowering of corporate tax rates, both Fannie & Freddie will make draws from the U.S. Treasury. With these draws included, it is estimated that U.S. Treasury's cumulative return on the investment in Fannie & Freddie exceeds 10% with cumulative net payments to U.S. Treasury of over $87 billion.

Trends in Pro Forma Pre-tax "Adjusted" Earnings: With the requirement to wind down other investments and the cost to cover risk transfer programs impacting earnings, the following is an attempt to create a pre-tax adjusted earnings trends estimate for Fannie & Freddie. While there may be alternative approaches (this is my approach), generally this approach suggests that Fannie & Freddie are now generating pre-tax adjusted earnings in the $25 - $30 billion range annually.

Investments in Common Securitization Solutions and Related Projects: As progress continues on the Single Security and common securitization platform, Fannie & Freddie continue to make investments in Common Securitization Solutions LLC (CSS). Through Q4 2017, the cumulative investments in CSS totaled $658 million.

Affordable Housing Payments: And finally, Fannie & Freddie play a critically important role in support of affordable housing, including allocations to various housing trust funds. For 2017, these combined housing trust fund allocations accrued totaled $414 million. One of the other GSEs - Federal Home Loan Banks - also have assessments contributing to affordable housing, through Q3 2017, these assessments totaled $286 million. Combined these GSEs provide approximately $700 - $800 million annually to affordable housing through these allocations and assessments - critically important roles!