Proposed Reg Relief Bill Promising for Community Banks - and Exemplifies Bipartisan Leadership!

Senate Banking Committee’s announcement on bipartisan bank regulatory relief bill very promising. And it exemplifies how bipartisan leadership - led by Senator Crapo and this group of senators - can formulate reasonable principles for legislative action. Cosponsors include: Republicans: Mike Crapo (R-Idaho), Bob Corker (R-Tennessee), Tim Scott (R-South Carolina), Tom Cotton (R-Arkansas), Mike Rounds (R-South Dakota), David Perdue (R-Georgia), Thom Tillis (R-North Carolina), John Kennedy (R-Louisiana), Jerry Moran (R-Kansas) and Democrats: Joe Donnelly (D-Indiana), Heidi Heitkamp (D-North Dakota), Jon Tester (D-Montana), Mark Warner (D-Virginia), Tim Kaine (D-Virginia), Angus King (I-Maine), Joe Manchin (D-West Virginia), Claire McCaskill (D-Missouri), and Gary Peters (D-Michigan).

Senator Crapo stated: "The bipartisan proposals on which we have agreed will significantly improve our financial regulatory framework and foster economic growth by right-sizing regulation, particularly for smaller financial institutions and community banks."

The press release summarizes key aspects of the proposed legislation as improving consumer access to mortgage credit; providing regulatory relief for small financial institutions and protects consumer access to credit; providing specific protections for veterans, consumers and homeowners; and tailoring regulations for banks to better reflect their business models.

Here are links to: Press Release and Section-by-Section Summary.

One key element of the proposal is to provide regulatory relief to Community Banks if they meet a minimum Community Bank Leverage Ratio. Pending final legislative wording (and eventually regulatory wording), if we use a simple Tangible Equity Ratio (equity capital less intangible assets divided by total assets less intangible assets), the chart below estimates the number of Community Banks and percentage of Community Banks by asset size would achieve the target using the low, mid and high range of the proposal: 8%, 9% and 10%.

For example, if the Community Bank Leverage Ratio is established as a minimum of 8%, over 93 percent of Community Banks in the asset ranges below $1 billion would meet this standard. And, for Community Banks between $1 billion and $10 billion, 89 percent would meet the test. Is 8% workable? Remember that under Prompt Corrective Action thresholds, the leverage ratio (as defined under current regulation) is 5%. The lower range in this proposal is 300 basis points, or 60 percent higher! Seems reasonable?

At the midpoint of 9%, between 70 and 82 percent of Community Banks depending upon the asset ranges below $1 billion would meet this standard. And, for Community Banks between $1 billion and $10 billion, approximately 70 percent would meet the test.

We are early in the legislative process so only time will tell. But this is a great start and important bipartisan effort. Congratulations to Senator Crapo and the co-sponsors for initiating this proposal.

Will provide an update on this Blog when the final legislative text is available.

Homeownership, Net Worth and Future of Housing?

The housing sector has played an important role in our economy. While rebounding soundly from the Great Recession, the housing sector now appears to be taking that inevitable pause.

Where it goes from here remains to be seen. The issues facing the housing sector over the long term are many, possibly including a changing national "culture" on housing (i.e., has the "American Dream" of homeownership been conceded?).

Homeownership has been declining since 2004. Homeownership rate is down 5.5 percentage points, or the equivalent of 6.5 million potential proud homeowners.

The homeownership rate has declined across all age segments. The factors influencing homeownership are many, including millennial demographics, housing price levels, negative equity and housing turnover, metropolitan market migration, student debt loads, national policy and even the lingering memories - or nightmares - of the Great Recession.

Home_Ownership_Trends.jpg
Homeownership_Age_Segment_Trends.jpg

Two of the largest declines in homeownership rates occurred in the age segments of under 35 years of age and 35 to 44 years of age. These are age groups that represent initial home buyers and those families ready to upgrade to their second and larger home.

Home_Ownership_Age_Change_Peak.jpg

And there is one other critically important variable that may be impacting homeownership: household wealth or Net Worth.

These two age segments (under 35 years of age and between 35 and 44 years of age) are also groups that have not seen noticeable increases in net worth. Net worth data is from the Federal Reserve's triennial Survey of Consumer Finances. This chart shows median net worth in 2016 and annual growth rate in net worth from 1989 to 2016.

For example, the 35 to 44 Age Group had a median net worth of $59,800 in 2016. Since 1989, net worth for families traveling through this age group increased at only 0.2% per year. Or stated another way, 27 years later, the wealth of families with head of household in this age group in 2016 have not gained much ground compared to the wealth of families in this age group in 1989. While over this same period, home prices are up 2.6X; stock prices have climbed 7.2X.

Household_Net_Worth_Growth_Age.jpg

Households within these age groups achieved significant gains in net worth prior to the recession - both increase in equity as housing values rose (for homeowners) and buoyed by a rising stock market. By 2004 (peak year), the net worth for the age segment under 35 years of age was 81 percent higher than the households that comprised this cohort in 1989. For the age segment 35 to 44 years of age, net worth in 2007 (peak year) gained 56% compared to 1989 levels.

Unfortunately, net worth was seriously eroded during the Great Recession. And there has not been an appreciable recovery. The age segment under 35 years of age saw a 23% decline in net worth since 2004 peak and the age segment 35 to 44 years of age felt a 32% deterioration in their wealth since 2007. And the recovery through 2016 has returned the age segment under 35 years of age to a net worth level 41% better than 1989. But, for the age segment 35 to 44 years of age, their wealth is only 6 percent higher than the households that comprised this group in 1989.

Household_Net_Worth_Trends_Age_2.jpg

There is always the "chicken and egg" debate on which comes first: net worth or homeownership. However, it may be extremely important to understand the drivers of net worth for these age segments, strategies to improve their net worth positions and how this will impact the U.S. housing sector and national housing policy in the future. Or, alternatively, do we need to reshape our "culture" and expectations on housing and homeownership?

Loan Growth Continues at Community Banks; Demand Slows at Large Banks.

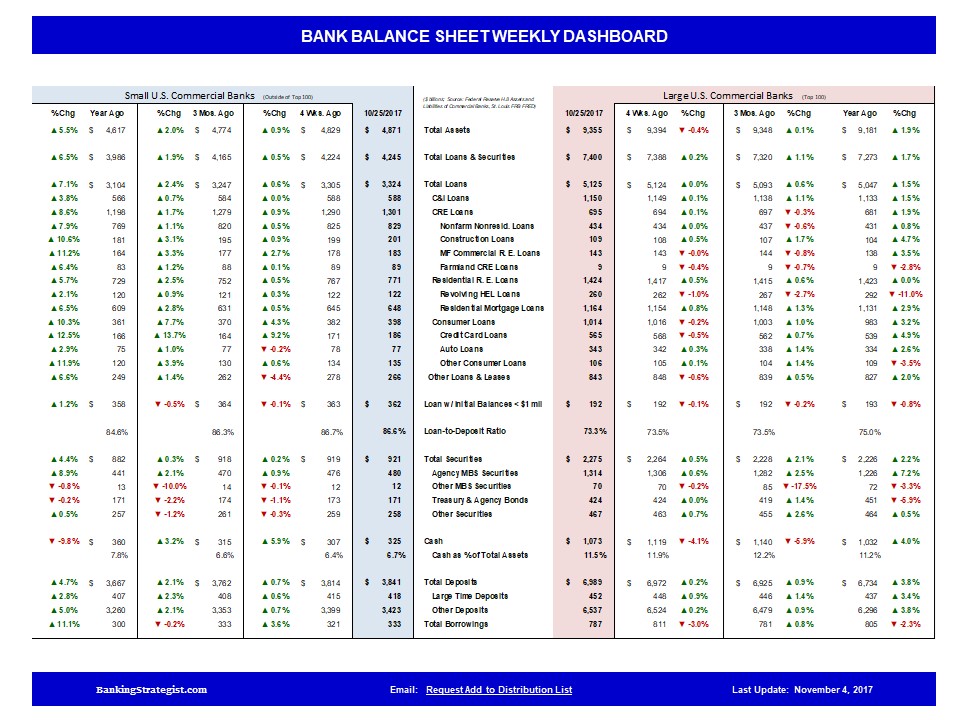
In our "Bank Balance Sheet Weekly Dashboard", loan demand at Community Banks continues solid over the past month based upon data from the Federal Reserve's H.8 report, while loan demand at the largest banks continues to moderate.

Commercial and industrial lending slowed across the banking industry. Community Banks had solid growth across most categories. Large banks (top 25) showed growth in residential mortgages and construction loans.

On deposit front - similar story, good growth at Community Banks while more moderate growth at the larger banks.

For further information and analysis, go to Banking Strategist.

2018 Community Bank Planning - Finalizing Your Scenario

November is nearly upon us. Time for Community Banks to lock in your planning scenario for 2018.  

So let’s look at some recent national economic data and commentary and see how these may impact bankers as you tweak or finalize your macroeconomic assumptions: 

Economic Growth: GDP growth hit 3% in Q3 initial estimate with approximately 0.7% due to inventory build up. Consensus forecasts were slightly lower with business investment higher than anticipated. This economic cycle's longevity continues - one of longest historically. For 2018, consensus forecast remains for moderate growth in real GDP (~2.4%).

Employment and Labor Markets: September non-farm payroll was down, although unemployment rate improved - as did many other labor market indicators. Consensus forecasts suggest modest job growth and unemployment rate trending slightly below today's levels.

Housing Sector: Housing starts, building permits and existing home sales were down in September while new home sales jumped. Consensus estimates for next year suggest moderate growth. Home price increases are expected to slow, but vary significantly by market.

Inflation and Prices: Inflation remains low with core PCE well below Fed's 2 percent target. Commodity prices are mixed. Low inflation remains consensus view through 2018 (and beyond).

Interest Rates: Fed appears ready to pull trigger in December and consensus view is for continued Fed Funds increases quarterly in 2018 - at least 3 times. Yield curve is expected to rise but flatten slightly (see a "Base Case" Scenario concept below).

Banking Sector: Loan growth has generally been slowing with Community Banks showing stronger growth than the larger banks. While loan growth may continue, it may be much lower than experienced in 2017. On the deposit front, 2017 growth continues at moderate pace and 2018 may see continued growth but also at slower pace.

Midwest Region Issues and Risks: As you finalize your planning scenario for 2018, there remain several continuing open issues and risks. (1) Automotive Sector: Are rising sales incentives a harbinger of rough patch? Will sales slow (latest 12 months through September are down 1.4%)? Any impact on your local market employment? (2) Agriculture Sector: Will commodity prices remain low? How will farm land prices hold up in your area? Will agricultural equipment manufacturers slow production - and local employment? (See our economic dashboards for Illinois, Indiana, Michigan and Wisconsin at Economic Dashboards).

There appears to be general consensus of moderate growth with slowly rising interest rates for 2018. No one has suggested any major disruption.

Capital Requirements: Finally, minimum capital ratios rise another 62.5 bps on January 1, 2018. Make certain that this change is incorporated into your financial forecasting, balance sheet and capital management and dividend planning for 2018.

Good luck on your setting of your final 2018 planning scenario. And much continued success throughout next year!

Banking Strategist compiles economic data throughout each month and updates our U.S. Economic Dashboard weekly and post to our website at this link: U.S. Economic Dashboard.

IMG_0797.JPG

FDIC Chair Speaks to Importance of Community Banks!

FDIC Chair Gruenberg speech on “The Importance of Community Banks to the U.S. Financial System and Economy” is worth reading.

He touches on a multitude of topics, concluding that community banks continue to fill a vital niche in our financial system and remain essential in servicing local communities that often are not served by larger banks or non-bank financial institutions.

He stresses the importance for community banks to not underestimate several of the continuing challenges they face: (1) low interest rates, (2) regulatory compliance, (3) information technology and (4) succession planning and recruitment, nor to underestimate their underlying strength.

One of his concluding comments is that “the strong post-crisis performance of community banks underscores their vitality and the critically important role that they play and will continue to play in the financial system and economy of the United States”. (boldface added)

The full text of his speech is located on the FDIC website through this link: “The Importance of Community Banks to the U.S. Financial System and Economy”.