2020 Planning - "How Can You Have Any Pudding, If You Don't Eat Yer Meat?"

As you continue your 2020 planning, the growth of the economy - U.S., regional and local - are key to establishing one of your baseline assumptions.

Remember that lyric from “The Wall” by Pink Floyd: “How can you have any pudding, if you don’t eat yer meat?”

The question for the economy is “How can you have strong economic growth, if business investment continues to be constrained?” Or if the services sector is weak?

Let’s look at the key components of GDP reported this week and their contribution to GDP’s 1.9% growth rate:

GDP_Bar_Dollar_Growth.jpg
GDP_Growth_Contribution.jpg

Consumer spending remained strong. Non-durable Goods is a $3 trillion component of the economy and grew by a strong 4.4%; while Durable Goods - a $1.8 trillion component - exhibited an outstanding 7.4% growth. These two components contributed 1.1 percentage points to GDP growth.

The consumer remains confident. If this continues into 2020, it will be one of the key engines of growth.

But there are two areas that are not showing the growth needed for a stronger growth rate in GDP for 2020:

  • Services: this is the largest component of our economy at $8.6 trillion, growing at only 1.7%. Representing 43% of our economy, if this component continues at this subpar growth, the economy in 2020 will have limits on its growth.

  • Business Investment in Equipment and Structures: These two components total $1.8 trillion. Both categories contracted during the second quarter - contracted GDP growth by (0.7) percentage points (wrong direction!). Forget any survey on business confidence, these two categories tell the story. If business investment does not pick up, 2020 economic growth will be very weak.

For 2020, business confidence will be key. If it weakens, there could be fall out into consumer spending. The Fed has taken some actions to support confidence in the economy. If the trade negotiations reach a compromise, this could be a critically important factor. Global economic growth will still be a worry. The agricultural sector remains under stress. The 2020 U.S. election will be an element of uncertainty as will other activity in D.C.

So, as you plan out your business for 2020, there are many uncertainties that remain. The economy is still solid and economic growth - albeit, slower - will occur. What are the key drivers of the economy in your regional and local markets that will further impact your planning assumptions?

Good luck! And much continued success!


2020 Bank Planning

It’s October already. Time for Halloween and trick or treating. And, as you prepare your 2020 annual operating plan, will the economy trick or treat you!

There appears to be some consensus among economists on the direction of the U.S. economy during 2020.

Here are some thoughts on 2020 and possible planning scenario for you to consider.

Monetary Policy:

  • If trade wars persist, Fed continues to lower Fed Funds rate.

  • Balance sheet strategy results in additional $1.5 trillion support for U.S. Treasury market.

Interest Rates:

  • Federal Reserve to reduce Fed Funds twice in increments of 25 bps: assume Q4 2019 and Q2 2020.

  • Short end of yield curve will mirror Fed Funds and drop by 50 bps in total.

  • Normal upward sloping yield curve will be pressured; although with Federal Reserve actions, long end will only drop 25 bps with yield curve flattening.

Bank Planning Checklist:

  • Community Bank Leverage Ratio framework opt-in decision by Q1 2020 Call Report filing.

  • Loan growth: slower than 2019.

  • Deposit growth: with low interest rate environment, moderating growth.

  • Loan quality: remains solid, except for agriculture.

  • NIM and spreads: with continued flat yield curve, margins will be under modest pressures again.

Key Drivers of Uncertainty:

  • Trade war and negotiations.

  • 2020 election.

  • Global economies.

  • Weather and climate (hurricanes, flooding, etc.).

National Economy:

  • Economy in 12th year of expansion.

  • Slower economic growth with consensus GDP increasing only 1.8%.

  • Job growth remains solid but slowing at 1.8 million new jobs.

  • Unemployment rate remains low, but rises slightly toward 4%.

Key Sectors:

  • Housing: solid performance but weaker than 2019.

  • Agriculture: if trade wars persist, recessionary conditions; commodity prices remain low; profitability decreasing.

  • Manufacturing: continued weakening.

Fiscal Policy:

  • +$1 trillion deficits continue.

  • Federal debt outstanding continues to rise.

Most importantly, what is happening in your local market that may deviate from the national statistics. Slightly stronger? Or weaker? Heavily agriculture? Manufacturing plants beginning layoffs?

Hopefully, 2020 will be a good year for your bank. Use this as a discussion item for your annual operating planning activities. And create your final planning assumptions for the 2020 economy and the impact on your bank.

Also, remember that there will be an opt-in for the Community Bank Leverage Ratio framework when you file your Q1 2020 Call Report, so you need to give further consideration to how you want to proceed.

Good luck and much continued success in 2020!


Community Bank Leverage Ratio - Final Rule

The FDIC issued the final rule on the Community Bank Leverage Ratio (CBL Ratio) on 9/17/2019.

Here are several key items:

  • THIS IS AN OPTIONAL PROGRAM

  • Effective in Q1 2020

  • Tier 1 Leverage Ratio must be greater than 9 percent

  • Community banks must have less than $10 billion in total assets

  • Must have limited amounts of off-balance-sheet exposures

A Community Bank that opts-in will not be required to report or calculate risk-based capital.

A Community Bank may opt-out at a later date, but would be required to start reporting and calculating risk-based capital again.

The links to the FDIC announcements are here:

The FDIC has indicated that it will issue an implementation guide in the near future to further clarify this optional capital framework.

As the chart above indicates, most Community Banks are holding capital above the minimum required Tier 1 Leverage Ratio of 9 percent required under the CBL Ratio capital framework.

Therefore, most Community Banks will have a decision to make: opt-in for the CBL Ratio framework or continue to use the risk-based capital framework that you have been using for more than a decade.

There is a cost or loss of income as the chart above very roughly lays out. In this chart, the opportunity cost is the lost R.O.A. on the balance sheet expansion associated with a 9% Tier 1 Leverage Ratio compared to an 11% Tier 1 Leverage Ratio. For a $25 million Community Bank that is lost income of $83 thousand - lower Total Assets of $5.5 million times pre-tax R.O.A. of 1.5%. There is also an impact on capital and dividend management.

There are several questions or issues for consideration as you move forward with your decision on whether to elect to implement the new CBL Ratio framework:

  1. What do you calculate as the cost burden of complying with the current risk-based capital rules?

  2. Will you need any of the excess levels of capital (i.e., above current capital rule requirements) in the future for balance sheet growth, acquisitions or returning capital to shareholders?

  3. How difficult or costly will it be to opt back out of the CBL Ratio capital framework and restart the risk-based capital framework at a later date?

Take some time to assess these questions and issues. Some Community Banks will conclude that this new CBL Ratio framework is a reasonable approach, you do not need the extra capital and will elect to opt-in. Other Community Banks will conclude that this new framework is not appropriate given their view of balance sheet growth, acquisitions and capital and dividend management issues that they may face in the future and will elect not to opt-in.

There are trade-offs and it is important to evaluate the best course for your bank.

Good luck!

Mid-year Update on Community Banking Consolidation

With our mid-year update, the banking industry consolidation continues:

  1. 5,303 banking charters remain with over 97% being Community Banks (Total Assets < $10 billion);

  2. Net reduction of 239, or 4.3% over the latest four quarters;

  3. Bank mergers continue with just under 250 over latest four quarters;

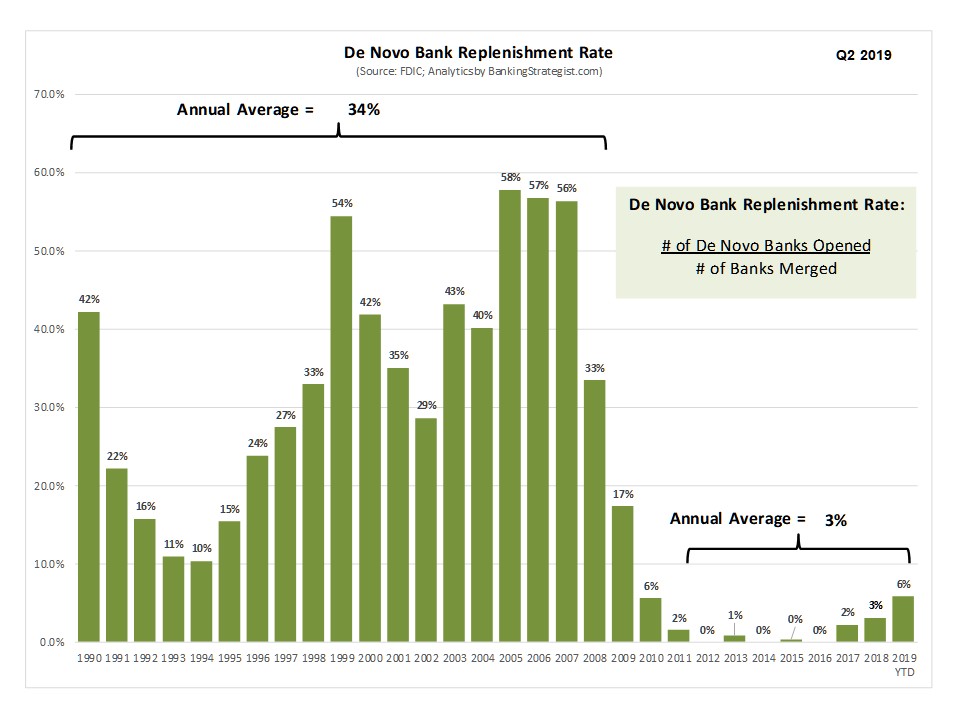
  4. De Novo Bank Replenishment Rate only 3% (i.e., de novo banks replacing only 3 percent of banks lost to mergers); and

  5. Impact of decline in bank charters primarily felt by Community Banks and in smaller markets.

Bank_Charter_Size_Pie.jpg

Of the 248 bank charter decline over the last four quarters, only 9 charters were replenished by de novo bank start-ups. There was only one bank failure during this timeframe. The net attrition rate of 4.3% is comparable to historical averages.

Bank_Charter_Walk_L12M.jpg

Bank mergers are a key component of many banker’s strategic planning currently and have been over the last several decades. And bank merger activity continues today with approximately 247 completed over the last four quarters. While down significantly from the average of 482 mergers from 1990 to 2008, merger activity is comparable to that occurring over the last several years.

Bank_Merger_Trends_1990.jpg

De novo banking is no longer a significant activity to rebuild the ranks of community banks. If you look at the De Novo Bank Replenishment Rate, this phenomenon is clear. We will define this metric as the number of de novo banks opened divided by the number of banks that have merged. From 1990 through 2008, the De Novo Bank Replenishment Rate averaged 34% - that is, for every 100 bank mergers, there were 34 de novo start-ups that opened. Over the last several years, this metric averaged only 3%.

De Novo Bank Replrenishment Rate_v2.jpg

The decline in the number of banking charters is predominantly occurring among smaller Community Banks - banks with Total Assets of less than $250 million. The number of banks in these asset classes dropped by 238. There was net growth in Community Banks with Total Assets between $1 billion and $10 billion.

Community_Bank_Charter_Chg_YoY_Bar.jpg

And where geographically is this consolidation occurring? Illinois and Texas had significant reductions of 22 and 19, respectively. Six states had declines in the number of banks by 10 or more: Iowa, Minnesota, Wisconsin, Kansas, California and Pennsylvania.

Bank_Charter_State_Walk.jpg

And does the size of the market have relevance? While the smallest counties had sizable declines, larger population areas also had fewer banks. If we use County population as the measure, there was a drop of 51 banks headquartered in markets with populations greater than 750,000. And, at the other end of the spectrum, there was a reduction of 99 banks headquartered in counties with populations of less than 50,000. This continued decline in smaller, rural markets is concerning, given the importance of local, community banks to these markets.

Bank_Charters_County_Analysis_YoYChg.jpg

The banking industry consolidation continues its decades long run with no end in sight. Bank mergers are ongoing. Bank Failures will occur from time to time. The historic replenishment role that de novo banks played is all, but gone. Look for our semi-annual updates. And for more data and analytics on the banking industry, go to www.BankingStrategist.com.

Bank Strategic Planning Topic: U.S. Economic Growth - First Look at Q2 2019 GDP

As you commence your summer strategic planning team discussions, a look at the growth of the U.S. economy may be helpful.

Q2 GDP slowed to 2.1 percent, but showed both strengths and weaknesses as the GDP growth “walk” below indicates.

Three sectors drove the Q2 results. Services, Durable Goods and Non-durable Goods contributed 2.1 percentage points to this quarter’s growth rate. The consumer is still spending and demand in the Services sector remains solid.

And, as was expected, the change this quarter in Net Exports and Inventories reversed their unusually large contribution of Q1 2019. These areas weighed negatively on GDP growth by 1.6 percentage points. Typically, these two components should have a negligible contribution to GDP growth - not the large positive seen in Q1 or the significant negative seen this quarter.

The continued lack of Business investment in Q2 raises the most important question - when will Business add to plant and equipment? What is weighing on its view of the near-term future?

Finally, Residential Investment continues to be a non-contributor, even in this favorable interest rate environment. Will this continue?

Two sectors had double digit growth in Q2: Durable Goods at 12.3% (twice the trend since 2010) and Non-defense Federal Spending at 15.1% (30X trend since 2010). The second category is probably not on anyone’s list for this elevated level of growth.

The largest sector of the economy - Services - had solid growth of 2.5% (slightly above 2% trend since 2010). The next largest - Non-durable Goods - expands by 5.9% annualized in Q2 (3X trend since 2010)

The Residential sector contracted by 1.5%.

And Business Investment in Structures fell a dramatic 11% (~3% trend since 2010). Business Investment in Equipment was up only 0.7% (6% trend since 2010). What is causing the Business sector to hold back on these critical investments?

The economy continues to grow, albeit more slowly. There are no signs that the economy will contract at this time. The employed consumer continues to spend. Labor market remains solid. But is employment growth a too cautious trade off for lack of business capacity investment? Are trade, weak global economic growth and political turmoil creating such uncertainties that Business is holding back on investing for future growth?

With the economic cycle reaching that record 120 months of age this quarter, there is much to celebrate! But we all know that the next question for the economy will be “What have you done for me lately?” And, while the economy chugs along, should you be planning for slower economic growth over the next five years and for 2020?

Hold your strategic planning session, have those discussions with your team, and see what conclusions you draw!